Backtesting.py 사용법
backtesting.py -1
유투브 참고
https://www.youtube.com/watch?v=e4ytbIm2Xg0&ab_channel=ChadThackray
https://kernc.github.io/backtesting.py/doc/backtesting/backtesting.html#backtesting.backtesting.Order.limit
import pandas as pd
import numpy as np
import seaborn as sns
from datetime import datetime
import matplotlib.pyplot as plt
ticker = 'KODEX 200'
start_date = datetime(2010, 1, 1)
df = pd.read_pickle("../crawling/data/etf_price.pickle")
df.columns = ['NAV','Open','High','Low','Close','Volume','Amount','base','ticker','code','Date']
df['Date'] = pd.to_datetime(df['Date'])
cond = (df['ticker']==ticker) & (df['Date']>start_date)
data = df[cond].reset_index(drop=True)
data = data[['Date','Open','High','Low','Close','Volume']].set_index('Date')
for col in data.columns:
    data[col] = pd.to_numeric(data[col]).astype('float')
data.info()
<class 'pandas.core.frame.DataFrame'>
DatetimeIndex: 3396 entries, 2010-01-04 to 2023-10-06
Data columns (total 5 columns):
 #   Column  Non-Null Count  Dtype
---  ------  --------------  -----
 0   Open    3396 non-null   float64
 1   High    3396 non-null   float64
 2   Low     3396 non-null   float64
 3   Close   3396 non-null   float64
 4   Volume  3396 non-null   float64
dtypes: float64(5)
memory usage: 159.2 KB
Strategy
- 전략을 설정하여 백테스트
- RSI 조건으로 매수, 매도
import talib
from backtesting import Backtest, Strategy
from backtesting.lib import crossover

class MyStrategy(Strategy):

    upper_bound = 67
    lower_bound = 33
    rsi_window=14

    def init(self):
        self.rsi = self.I(talib.RSI, self.data.Close, self.rsi_window)

    def next(self):
        if crossover(self.rsi, self.upper_bound):
            self.position.close()
        elif crossover(self.lower_bound, self.rsi):
            self.buy()

bt = Backtest(data, MyStrategy, cash=10000000, commission=0.002)
stats = bt.run()
print(stats)
bt.plot()
Start                     2010-01-04 00:00:00
End                       2023-10-06 00:00:00
Duration                   5023 days 00:00:00
Exposure Time [%]                   47.290931
Equity Final [$]                  11091864.24
Equity Peak [$]                   17417832.28
Return [%]                          10.918642
Buy & Hold Return [%]                41.23734
Return (Ann.) [%]                    0.771926
Volatility (Ann.) [%]               13.341861
Sharpe Ratio                         0.057857
Sortino Ratio                         0.08228
Calmar Ratio                          0.01836
Max. Drawdown [%]                  -42.044703
Avg. Drawdown [%]                   -3.154887
Max. Drawdown Duration     2031 days 00:00:00
Avg. Drawdown Duration       76 days 00:00:00
# Trades                                   20
Win Rate [%]                             70.0
Best Trade [%]                      11.105913
Worst Trade [%]                    -25.035937
Avg. Trade [%]                       0.821925
Max. Trade Duration         450 days 00:00:00
Avg. Trade Duration         120 days 00:00:00
Profit Factor                        1.551886
Expectancy [%]                       1.124611
SQN                                  0.228145
_strategy                          MyStrategy
_equity_curve                             ...
_trades                       Size  EntryB...
dtype: object
Row(
id = '35273', …)
Optimizer
지표의 하이퍼파라미터를 최적화
- 파라미터 : RSI upper_bound, lower_bound, rsi_window
- 최적화 조건 설정 : optim_func
- 결과 저장 : bt.plot(filnename설정)
import talib
from backtesting import Backtest, Strategy
from backtesting.lib import crossover

def optim_func(series):

    if series['# Trades'] < 30: #최소 트레이드 회수 제한
        return -1
    return series['Equity Final [$]'] / series['Exposure Time [%]']
    #return series['Sharpe Ratio']


class MyStrategy(Strategy):

    upper_bound = 70
    lower_bound = 30
    rsi_window=14

    def init(self):
        self.rsi = self.I(talib.RSI, self.data.Close, self.rsi_window)

    def next(self):
        if crossover(self.rsi, self.upper_bound):
            self.position.close()
        elif crossover(self.lower_bound, self.rsi):
            self.buy()

bt = Backtest(data, MyStrategy, cash=10000000, commission=0.002)
stats = bt.optimize(
    upper_bound=range(50, 85, 1),
    lower_bound=range(10, 45, 1),
    rsi_window=range(10,30,1),
    maximize = optim_func, #'Sharpe Ratio',
    constraint = lambda param : param.upper_bound > param.lower_bound,
    max_tries=100 # randomly simulations, 오버피팅 방지..
    )

lower_bound = stats['_strategy'].lower_bound
upper_bound = stats['_strategy'].upper_bound
rsi_window = stats['_strategy'].rsi_window
print(lower_bound,"-", upper_bound,"-", rsi_window)
print(stats)

bt.plot()
#filename있으면 저장을합니다.

# bt.plot(filename=f'plots/{datetime.now().strftime("%Y%m%d")}_{lower_bound}_{upper_bound}.html')
/Users/byeongsikbu/opt/anaconda3/envs/dct/lib/python3.10/site-packages/backtesting/backtesting.py:1375: UserWarning: For multiprocessing support in `Backtest.optimize()` set multiprocessing start method to 'fork'.
  warnings.warn("For multiprocessing support in `Backtest.optimize()` "


  0%|          | 0/9 [00:00<?, ?it/s]


36 - 53 - 16
Start                     2010-01-04 00:00:00
End                       2023-10-06 00:00:00
Duration                   5023 days 00:00:00
Exposure Time [%]                   25.912839
Equity Final [$]                  12215340.55
Equity Peak [$]                    12568343.2
Return [%]                          22.153406
Buy & Hold Return [%]                41.23734
Return (Ann.) [%]                    1.495976
Volatility (Ann.) [%]               11.227801
Sharpe Ratio                         0.133239
Sortino Ratio                        0.192884
Calmar Ratio                         0.046011
Max. Drawdown [%]                  -32.513102
Avg. Drawdown [%]                   -3.777746
Max. Drawdown Duration     1934 days 00:00:00
Avg. Drawdown Duration      136 days 00:00:00
# Trades                                   39
Win Rate [%]                        64.102564
Best Trade [%]                       7.401241
Worst Trade [%]                      -9.27555
Avg. Trade [%]                       0.854879
Max. Trade Duration         105 days 00:00:00
Avg. Trade Duration          33 days 00:00:00
Profit Factor                        1.859875
Expectancy [%]                       0.920323
SQN                                  0.928929
_strategy                 MyStrategy(upper...
_equity_curve                             ...
_trades                       Size  EntryB...
dtype: object
Row(
id = '51852', …)
display(stats['_strategy'])
display(stats['_trades'])
<Strategy MyStrategy(upper_bound=53,lower_bound=36,rsi_window=16)>
| Size | EntryBar | ExitBar | EntryPrice | ExitPrice | PnL | ReturnPct | EntryTime | ExitTime | Duration | |
|---|---|---|---|---|---|---|---|---|---|---|
| 0 | 466 | 20 | 44 | 21427.77 | 22180.0 | 350539.18 | 0.035105 | 2010-02-01 | 2010-03-09 | 36 days |
| 1 | 474 | 87 | 110 | 21803.52 | 22150.0 | 164231.52 | 0.015891 | 2010-05-10 | 2010-06-14 | 35 days |
| 2 | 392 | 278 | 304 | 26813.52 | 27075.0 | 102500.16 | 0.009752 | 2011-02-14 | 2011-03-23 | 37 days |
| 3 | 1 | 432 | 444 | 22234.38 | 23880.0 | 1645.62 | 0.074012 | 2011-09-27 | 2011-10-14 | 17 days |
| 4 | 419 | 398 | 444 | 25280.46 | 23880.0 | -586792.74 | -0.055397 | 2011-08-05 | 2011-10-14 | 70 days |
| 5 | 1 | 604 | 614 | 23997.90 | 25500.0 | 1502.10 | 0.062593 | 2012-06-05 | 2012-06-20 | 15 days |
| 6 | 385 | 588 | 614 | 25991.88 | 25500.0 | -189373.80 | -0.018924 | 2012-05-11 | 2012-06-20 | 40 days |
| 7 | 413 | 631 | 643 | 23782.47 | 24550.0 | 316989.89 | 0.032273 | 2012-07-13 | 2012-07-31 | 18 days |
| 8 | 407 | 704 | 726 | 24919.74 | 25250.0 | 134415.82 | 0.013253 | 2012-10-29 | 2012-11-28 | 30 days |
| 9 | 395 | 803 | 808 | 26016.93 | 26600.0 | 230312.65 | 0.022411 | 2013-03-25 | 2013-04-01 | 7 days |
| 10 | 411 | 813 | 841 | 25601.10 | 25880.0 | 114627.90 | 0.010894 | 2013-04-08 | 2013-05-20 | 42 days |
| 11 | 427 | 858 | 887 | 24884.67 | 24620.0 | -113014.09 | -0.010636 | 2013-06-13 | 2013-07-24 | 41 days |
| 12 | 422 | 1016 | 1029 | 24909.72 | 25670.0 | 320838.16 | 0.030521 | 2014-02-05 | 2014-02-24 | 19 days |
| 13 | 425 | 1078 | 1084 | 25480.86 | 26160.0 | 288634.50 | 0.026653 | 2014-05-07 | 2014-05-15 | 8 days |
| 14 | 435 | 1177 | 1206 | 25571.04 | 25025.0 | -237527.40 | -0.021354 | 2014-10-01 | 2014-11-13 | 43 days |
| 15 | 442 | 1231 | 1237 | 24604.11 | 25035.0 | 190453.38 | 0.017513 | 2014-12-18 | 2014-12-29 | 11 days |
| 16 | 456 | 1242 | 1247 | 24288.48 | 24890.0 | 274293.12 | 0.024766 | 2015-01-07 | 2015-01-14 | 7 days |
| 17 | 446 | 1342 | 1416 | 25455.81 | 24085.0 | -611381.26 | -0.053851 | 2015-06-04 | 2015-09-17 | 105 days |
| 18 | 443 | 1456 | 1462 | 24243.39 | 24740.0 | 219998.23 | 0.020484 | 2015-11-17 | 2015-11-25 | 8 days |
| 19 | 478 | 1500 | 1518 | 22915.74 | 23770.0 | 408336.28 | 0.037278 | 2016-01-21 | 2016-02-19 | 29 days |
| 20 | 474 | 1575 | 1590 | 23982.87 | 24435.0 | 214309.62 | 0.018852 | 2016-05-16 | 2016-06-07 | 22 days |
| 21 | 379 | 1885 | 1908 | 30571.02 | 31190.0 | 234593.42 | 0.020247 | 2017-08-14 | 2017-09-15 | 32 days |
| 22 | 368 | 1972 | 1977 | 32129.13 | 33070.0 | 346240.16 | 0.029284 | 2017-12-22 | 2018-01-03 | 12 days |
| 23 | 386 | 2003 | 2023 | 31507.89 | 32460.0 | 367514.46 | 0.030218 | 2018-02-08 | 2018-03-13 | 33 days |
| 24 | 412 | 2089 | 2137 | 30380.64 | 29860.0 | -214503.68 | -0.017137 | 2018-06-20 | 2018-08-28 | 69 days |
| 25 | 444 | 2165 | 2202 | 27760.41 | 27525.0 | -104522.04 | -0.008480 | 2018-10-12 | 2018-12-04 | 53 days |
| 26 | 437 | 2305 | 2328 | 27945.78 | 27330.0 | -269095.86 | -0.022035 | 2019-05-09 | 2019-06-12 | 34 days |
| 27 | 455 | 2366 | 2388 | 26262.42 | 26250.0 | -5651.10 | -0.000473 | 2019-08-05 | 2019-09-05 | 31 days |
| 28 | 418 | 2502 | 2540 | 28536.96 | 25890.0 | -1106429.28 | -0.092756 | 2020-02-25 | 2020-04-20 | 55 days |
| 29 | 358 | 2672 | 2676 | 30270.42 | 32220.0 | 697949.64 | 0.064405 | 2020-11-02 | 2020-11-06 | 4 days |
| 30 | 276 | 2869 | 2934 | 41753.34 | 39885.0 | -515661.84 | -0.044747 | 2021-08-17 | 2021-11-23 | 98 days |
| 31 | 293 | 2940 | 2945 | 37620.09 | 39975.0 | 689988.63 | 0.062597 | 2021-12-01 | 2021-12-08 | 7 days |
| 32 | 311 | 2978 | 3021 | 37580.01 | 36925.0 | -203708.11 | -0.017430 | 2022-01-25 | 2022-04-01 | 66 days |
| 33 | 335 | 3047 | 3063 | 34363.59 | 35240.0 | 293597.35 | 0.025504 | 2022-05-10 | 2022-06-02 | 23 days |
| 34 | 363 | 3070 | 3103 | 32474.82 | 32500.0 | 9140.34 | 0.000775 | 2022-06-14 | 2022-07-29 | 45 days |
| 35 | 379 | 3131 | 3163 | 31147.17 | 29690.0 | -552267.43 | -0.046783 | 2022-09-08 | 2022-10-28 | 50 days |
| 36 | 381 | 3209 | 3214 | 29513.91 | 31345.0 | 697645.29 | 0.062042 | 2023-01-03 | 2023-01-10 | 7 days |
| 37 | 361 | 3365 | 3375 | 33050.97 | 34010.0 | 346209.83 | 0.029017 | 2023-08-21 | 2023-09-04 | 14 days |
| 38 | 381 | 3394 | 3395 | 32299.47 | 32060.0 | -91238.07 | -0.007414 | 2023-10-05 | 2023-10-06 | 1 days |
hemtmap
최적화 결과를 히트맵으로 표현하여, 어떤 파라미터가 유용했는지 시각적으로 확인가능
import talib
from backtesting import Backtest, Strategy
from backtesting.lib import crossover, plot_heatmaps

def optim_func(series):

    if series['# Trades'] < 3: #최소 트레이드 회수 제한
        return -1
    #return series['Equity Final [$]'] / series['Exposure Time [%]']
    return series['Sharpe Ratio']


class MyStrategy(Strategy):

    upper_bound = 70
    lower_bound = 30
    rsi_window=14

    def init(self):
        self.rsi = self.I(talib.RSI, self.data.Close, self.rsi_window)

    def next(self):
        if crossover(self.rsi, self.upper_bound):
            self.position.close()
        elif crossover(self.lower_bound, self.rsi):
            self.buy()

bt = Backtest(data, MyStrategy, cash=10000000, commission=0.002)
stats, heatmap = bt.optimize(
    upper_bound=range(55, 85, 5),
    lower_bound=range(10, 45, 5),
    rsi_window=14,
    maximize = optim_func,#'Sharpe Ratio',
    constraint = lambda param : param.upper_bound > param.lower_bound,
    return_heatmap=True
    )

#print(heatmap)

hm = heatmap.groupby(['upper_bound', 'lower_bound']).mean().unstack()
#print(hm)
sns.heatmap(hm, annot=True, cmap='viridis')
plt.show()

lower_bound = stats['_strategy'].lower_bound
upper_bound = stats['_strategy'].upper_bound
rsi_window = stats['_strategy'].rsi_window
print("best :", lower_bound,"-", upper_bound,"-", rsi_window)
print(stats)

bt.plot()
display(stats['_trades'])
0%| | 0/9 [00:00<?, ?it/s]
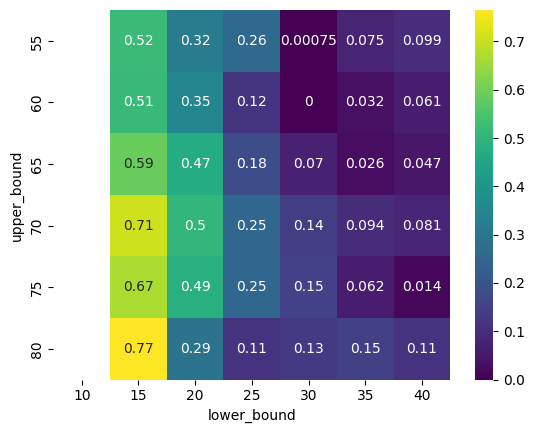
best : 15 - 80 - 14
Start                     2010-01-04 00:00:00
End                       2023-10-06 00:00:00
Duration                   5023 days 00:00:00
Exposure Time [%]                   16.872792
Equity Final [$]                  21689992.91
Equity Peak [$]                   21689992.91
Return [%]                         116.899929
Buy & Hold Return [%]                41.23734
Return (Ann.) [%]                    5.913693
Volatility (Ann.) [%]                7.728531
Sharpe Ratio                         0.765177
Sortino Ratio                        1.343684
Calmar Ratio                         0.611046
Max. Drawdown [%]                    -9.67799
Avg. Drawdown [%]                   -1.620457
Max. Drawdown Duration      163 days 00:00:00
Avg. Drawdown Duration       16 days 00:00:00
# Trades                                    3
Win Rate [%]                            100.0
Best Trade [%]                      56.254118
Worst Trade [%]                     13.836122
Avg. Trade [%]                      29.464016
Max. Trade Duration         506 days 00:00:00
Avg. Trade Duration         280 days 00:00:00
Profit Factor                             NaN
Expectancy [%]                      30.694484
SQN                                  1.966811
_strategy                 MyStrategy(upper...
_equity_curve                             ...
_trades                      Size  EntryBa...
dtype: object
| Size | EntryBar | ExitBar | EntryPrice | ExitPrice | PnL | ReturnPct | EntryTime | ExitTime | Duration | |
|---|---|---|---|---|---|---|---|---|---|---|
| 0 | 413 | 1188 | 1316 | 24188.28 | 27535.0 | 1382195.36 | 0.138361 | 2014-10-20 | 2015-04-24 | 186 days |
| 1 | 510 | 1399 | 1741 | 22304.52 | 27210.0 | 2501794.80 | 0.219932 | 2015-08-25 | 2017-01-12 | 506 days |
| 2 | 665 | 2520 | 2620 | 20866.65 | 32605.0 | 7806002.75 | 0.562541 | 2020-03-20 | 2020-08-13 | 146 days |
자체 내장되어 있는 heatmap을 사용하는 것도 가능
import talib
from backtesting import Backtest, Strategy
from backtesting.lib import crossover, plot_heatmaps

def optim_func(series):

    if series['# Trades'] < 3: #최소 트레이드 회수 제한
        return -1
    #return series['Equity Final [$]'] / series['Exposure Time [%]']
    return series['Sharpe Ratio']


class MyStrategy(Strategy):

    upper_bound = 70
    lower_bound = 30
    rsi_window=14

    def init(self):
        self.rsi = self.I(talib.RSI, self.data.Close, self.rsi_window)

    def next(self):
        if crossover(self.rsi, self.upper_bound):
            self.position.close()
        elif crossover(self.lower_bound, self.rsi):
            self.buy()

bt = Backtest(data, MyStrategy, cash=10000000, commission=0.002)
stats, heatmap = bt.optimize(
    upper_bound=range(55, 85, 5),
    lower_bound=range(10, 45, 5),
    rsi_window=range(10, 20, 2),
    maximize = optim_func,#'Sharpe Ratio',
    constraint = lambda param : param.upper_bound > param.lower_bound,
    return_heatmap=True
    )

#print(heatmap)

hm = heatmap.groupby(['upper_bound', 'lower_bound']).mean().unstack()
#print(hm)
# sns.heatmap(hm, annot=True, cmap='viridis')
# plt.show()
plot_heatmaps(heatmap, agg='mean')

lower_bound = stats['_strategy'].lower_bound
upper_bound = stats['_strategy'].upper_bound
rsi_window = stats['_strategy'].rsi_window
print("best :", lower_bound,"-", upper_bound,"-", rsi_window)
print(stats)

bt.plot()
display(stats['_trades'])
0%| | 0/9 [00:00<?, ?it/s]
best : 15 - 80 - 14
Start                     2010-01-04 00:00:00
End                       2023-10-06 00:00:00
Duration                   5023 days 00:00:00
Exposure Time [%]                   16.872792
Equity Final [$]                  21689992.91
Equity Peak [$]                   21689992.91
Return [%]                         116.899929
Buy & Hold Return [%]                41.23734
Return (Ann.) [%]                    5.913693
Volatility (Ann.) [%]                7.728531
Sharpe Ratio                         0.765177
Sortino Ratio                        1.343684
Calmar Ratio                         0.611046
Max. Drawdown [%]                    -9.67799
Avg. Drawdown [%]                   -1.620457
Max. Drawdown Duration      163 days 00:00:00
Avg. Drawdown Duration       16 days 00:00:00
# Trades                                    3
Win Rate [%]                            100.0
Best Trade [%]                      56.254118
Worst Trade [%]                     13.836122
Avg. Trade [%]                      29.464016
Max. Trade Duration         506 days 00:00:00
Avg. Trade Duration         280 days 00:00:00
Profit Factor                             NaN
Expectancy [%]                      30.694484
SQN                                  1.966811
_strategy                 MyStrategy(upper...
_equity_curve                             ...
_trades                      Size  EntryBa...
dtype: object
| Size | EntryBar | ExitBar | EntryPrice | ExitPrice | PnL | ReturnPct | EntryTime | ExitTime | Duration | |
|---|---|---|---|---|---|---|---|---|---|---|
| 0 | 413 | 1188 | 1316 | 24188.28 | 27535.0 | 1382195.36 | 0.138361 | 2014-10-20 | 2015-04-24 | 186 days |
| 1 | 510 | 1399 | 1741 | 22304.52 | 27210.0 | 2501794.80 | 0.219932 | 2015-08-25 | 2017-01-12 | 506 days |
| 2 | 665 | 2520 | 2620 | 20866.65 | 32605.0 | 7806002.75 | 0.562541 | 2020-03-20 | 2020-08-13 | 146 days |
multiple strategies
- 다른 시간대의 지표를 활용하는 전략
- 예를들어, rsi는 weekly, ma는 daily를 사용하는 전략
- resample_apply
import talib
from backtesting import Backtest, Strategy
from backtesting.lib import crossover, plot_heatmaps, resample_apply

def optim_func(series):

    if series['# Trades'] < 3: #최소 트레이드 회수 제한
        return -1
    #return series['Equity Final [$]'] / series['Exposure Time [%]']
    return series['Sharpe Ratio']


class MyStrategy(Strategy):

    upper_bound = 70
    lower_bound = 30
    rsi_window=14

    def init(self):
        self.daily_rsi = self.I(talib.RSI, self.data.Close, self.rsi_window)
        self.weekly_rsi = resample_apply(
            "W-FRI", talib.RSI, self.data.Close, self.rsi_window)

    def next(self):
        if (crossover(self.daily_rsi, self.upper_bound)
                and self.weekly_rsi[-1] > self.upper_bound):
            self.position.close()
        elif (crossover(self.lower_bound, self.daily_rsi)
                  and self.weekly_rsi[-1] < self.lower_bound
                    and self.daily_rsi[-1] < self.weekly_rsi[-1]):
            self.buy()

bt = Backtest(data, MyStrategy, cash=10000000, commission=0.002)
stats = bt.run()
# stats, heatmap = bt.optimize(
#     upper_bound=range(55, 85, 5),
#     lower_bound=range(10, 45, 5),
#     rsi_window=range(10, 20, 2),
#     maximize = optim_func,#'Sharpe Ratio',
#     constraint = lambda param : param.upper_bound > param.lower_bound,
#     return_heatmap=True
#     )

#print(heatmap)

#hm = heatmap.groupby(['upper_bound', 'lower_bound']).mean().unstack()
#print(hm)
# sns.heatmap(hm, annot=True, cmap='viridis')
# plt.show()
#plot_heatmaps(heatmap, agg='mean')

# lower_bound = stats['_strategy'].lower_bound
# upper_bound = stats['_strategy'].upper_bound
# rsi_window = stats['_strategy'].rsi_window
# print("best :", lower_bound,"-", upper_bound,"-", rsi_window)
print(stats)

bt.plot()
display(stats['_trades'])
Start                     2010-01-04 00:00:00
End                       2023-10-06 00:00:00
Duration                   5023 days 00:00:00
Exposure Time [%]                   47.055359
Equity Final [$]                  13323664.95
Equity Peak [$]                   14628839.95
Return [%]                          33.236649
Buy & Hold Return [%]                41.23734
Return (Ann.) [%]                    2.152193
Volatility (Ann.) [%]               10.862179
Sharpe Ratio                         0.198136
Sortino Ratio                        0.291684
Calmar Ratio                         0.109967
Max. Drawdown [%]                  -19.571261
Avg. Drawdown [%]                   -3.781761
Max. Drawdown Duration     3859 days 00:00:00
Avg. Drawdown Duration      157 days 00:00:00
# Trades                                    2
Win Rate [%]                            100.0
Best Trade [%]                      21.092631
Worst Trade [%]                     10.046459
Avg. Trade [%]                      15.437495
Max. Trade Duration        1984 days 00:00:00
Avg. Trade Duration        1179 days 00:00:00
Profit Factor                             NaN
Expectancy [%]                      15.569545
SQN                                  3.716169
_strategy                          MyStrategy
_equity_curve                             ...
_trades                      Size  EntryBa...
dtype: object
| Size | EntryBar | ExitBar | EntryPrice | ExitPrice | PnL | ReturnPct | EntryTime | ExitTime | Duration | |
|---|---|---|---|---|---|---|---|---|---|---|
| 0 | 444 | 408 | 1751 | 22519.95 | 27270.0 | 2109022.20 | 0.210926 | 2011-08-22 | 2017-01-26 | 1984 days |
| 1 | 415 | 3142 | 3395 | 29133.15 | 32060.0 | 1214642.75 | 0.100465 | 2022-09-27 | 2023-10-06 | 374 days |
Reversal Starategies
- long, short을 함께 하는 전략
- buy : 롱포지션, sell : 숏포지션
- close : 롱이든 숏이든 포지션 청산하는 것
- is_long, is_short : 포지션이 롱인지, 숏인지 확인 필요
import talib
from backtesting import Backtest, Strategy
from backtesting.lib import crossover, plot_heatmaps, resample_apply

def optim_func(series):

    if series['# Trades'] < 3: #최소 트레이드 회수 제한
        return -1
    #return series['Equity Final [$]'] / series['Exposure Time [%]']
    return series['Sharpe Ratio']


class MyStrategy(Strategy):

    upper_bound = 70
    lower_bound = 30
    rsi_window=14

    def init(self):
        self.daily_rsi = self.I(talib.RSI, self.data.Close, self.rsi_window)

    def next(self):
        if crossover(self.daily_rsi, self.upper_bound) :
            if self.position.is_long:
                #print(self.position.size)
                #print(self.position.pl_pct)
                self.position.close() # sell long positions 그런데, short position일 때도, 포지션을 청산함 >> 조심해야함
                self.sell() # buy short positions
        elif crossover(self.lower_bound, self.daily_rsi):
            if self.position.is_short or not self.position:
                self.position.close() # sell short positions 마찬가지로 조심해야함
                self.buy() # buy long positions

bt = Backtest(data, MyStrategy, cash=10000000, commission=0.002)
stats = bt.run()

print(stats)

bt.plot()
display(stats['_trades'])
Start                     2010-01-04 00:00:00
End                       2023-10-06 00:00:00
Duration                   5023 days 00:00:00
Exposure Time [%]                    99.26384
Equity Final [$]                    8422052.5
Equity Peak [$]                   20604231.69
Return [%]                         -15.779475
Buy & Hold Return [%]                41.23734
Return (Ann.) [%]                   -1.266248
Volatility (Ann.) [%]               20.348414
Sharpe Ratio                              0.0
Sortino Ratio                             0.0
Calmar Ratio                              0.0
Max. Drawdown [%]                  -64.240721
Avg. Drawdown [%]                   -3.076568
Max. Drawdown Duration     2478 days 00:00:00
Avg. Drawdown Duration       55 days 00:00:00
# Trades                                   27
Win Rate [%]                         70.37037
Best Trade [%]                      15.154307
Worst Trade [%]                    -42.439203
Avg. Trade [%]                      -0.635676
Max. Trade Duration         453 days 00:00:00
Avg. Trade Duration         185 days 00:00:00
Profit Factor                        1.037715
Expectancy [%]                       0.132015
SQN                                 -0.157789
_strategy                          MyStrategy
_equity_curve                             ...
_trades                       Size  EntryB...
dtype: object
| Size | EntryBar | ExitBar | EntryPrice | ExitPrice | PnL | ReturnPct | EntryTime | ExitTime | Duration | |
|---|---|---|---|---|---|---|---|---|---|---|
| 0 | 475 | 25 | 183 | 21036.99 | 24225.0 | 1514304.75 | 0.151543 | 2010-02-08 | 2010-09-28 | 232 days |
| 1 | -476 | 183 | 399 | 24176.55 | 25080.0 | -430042.20 | -0.037369 | 2010-09-28 | 2011-08-08 | 314 days |
| 2 | 441 | 399 | 526 | 25130.16 | 26780.0 | 727579.44 | 0.065652 | 2011-08-08 | 2012-02-10 | 186 days |
| 3 | -441 | 526 | 589 | 26726.44 | 25520.0 | 532040.04 | 0.045140 | 2012-02-10 | 2012-05-14 | 94 days |
| 4 | 482 | 589 | 737 | 25571.04 | 26215.0 | 310388.72 | 0.025183 | 2012-05-14 | 2012-12-13 | 213 days |
| 5 | -483 | 737 | 859 | 26162.57 | 24610.0 | 749891.31 | 0.059343 | 2012-12-13 | 2013-06-14 | 183 days |
| 6 | 543 | 859 | 920 | 24659.22 | 25790.0 | 614013.54 | 0.045856 | 2013-06-14 | 2013-09-10 | 88 days |
| 7 | -544 | 920 | 1079 | 25738.42 | 25195.0 | 295620.48 | 0.021113 | 2013-09-10 | 2014-05-08 | 240 days |
| 8 | 566 | 1079 | 1136 | 25245.39 | 26850.0 | 908209.26 | 0.063561 | 2014-05-08 | 2014-07-30 | 83 days |
| 9 | -568 | 1136 | 1178 | 26796.30 | 25110.0 | 957818.40 | 0.062930 | 2014-07-30 | 2014-10-02 | 64 days |
| 10 | 643 | 1178 | 1289 | 25160.22 | 26100.0 | 604278.54 | 0.037352 | 2014-10-02 | 2015-03-18 | 167 days |
| 11 | -644 | 1289 | 1350 | 26047.80 | 24935.0 | 716643.20 | 0.042721 | 2015-03-18 | 2015-06-16 | 90 days |
| 12 | 700 | 1350 | 1447 | 24984.87 | 25330.0 | 241591.00 | 0.013814 | 2015-06-16 | 2015-11-04 | 141 days |
| 13 | -701 | 1447 | 1582 | 25279.34 | 23885.0 | 977432.34 | 0.055157 | 2015-11-04 | 2016-05-25 | 203 days |
| 14 | 782 | 1582 | 1726 | 23932.77 | 26265.0 | 1823803.86 | 0.097449 | 2016-05-25 | 2016-12-21 | 210 days |
| 15 | -783 | 1726 | 1885 | 26212.47 | 30510.0 | -3364965.99 | -0.163950 | 2016-12-21 | 2017-08-14 | 236 days |
| 16 | 561 | 1885 | 1920 | 30571.02 | 32405.0 | 1028862.78 | 0.059991 | 2017-08-14 | 2017-10-11 | 58 days |
| 17 | -562 | 1920 | 2003 | 32340.19 | 31445.0 | 503096.78 | 0.027680 | 2017-10-11 | 2018-02-08 | 120 days |
| 18 | 593 | 2003 | 2238 | 31507.89 | 28640.0 | -1700658.77 | -0.091021 | 2018-02-08 | 2019-01-28 | 354 days |
| 19 | -595 | 2238 | 2306 | 28582.72 | 27320.0 | 751318.40 | 0.044178 | 2019-01-28 | 2019-05-10 | 102 days |
| 20 | 648 | 2306 | 2396 | 27374.64 | 27280.0 | -61326.72 | -0.003457 | 2019-05-10 | 2019-09-19 | 132 days |
| 21 | -650 | 2396 | 2506 | 27225.44 | 27325.0 | -64714.00 | -0.003657 | 2019-09-19 | 2020-03-02 | 165 days |
| 22 | 644 | 2506 | 2570 | 27379.65 | 28965.0 | 1020965.40 | 0.057902 | 2020-03-02 | 2020-06-04 | 94 days |
| 23 | -645 | 2570 | 2870 | 28907.07 | 41175.0 | -7912814.85 | -0.424392 | 2020-06-04 | 2021-08-18 | 440 days |
| 24 | 260 | 2870 | 3174 | 41257.35 | 32435.0 | -2293811.00 | -0.213837 | 2021-08-18 | 2022-11-14 | 453 days |
| 25 | -261 | 3174 | 3394 | 32370.13 | 32235.0 | 35268.93 | 0.004175 | 2022-11-14 | 2023-10-05 | 325 days |
| 26 | 262 | 3394 | 3395 | 32299.47 | 32060.0 | -62741.14 | -0.007414 | 2023-10-05 | 2023-10-06 | 1 days |
Take Profits and Stop Losses
- 수익실현, 스탑로스 설정
import talib
from backtesting import Backtest, Strategy
from backtesting.lib import crossover, plot_heatmaps, resample_apply

def optim_func(series):

    if series['# Trades'] < 3: #최소 트레이드 회수 제한
        return -1
    #return series['Equity Final [$]'] / series['Exposure Time [%]']
    return series['Sharpe Ratio']


class MyStrategy(Strategy):

    upper_bound = 70
    lower_bound = 30
    rsi_window=14

    def init(self):
        self.daily_rsi = self.I(talib.RSI, self.data.Close, self.rsi_window)

    def next(self):

        price = self.data.Close[-1] # recent value

        if crossover(self.daily_rsi, self.upper_bound) :
            self.position.close()

        elif crossover(self.lower_bound, self.daily_rsi):
            self.buy(tp=1.05*price, sl = 0.97*price) # sl : stop loss

bt = Backtest(data, MyStrategy, cash=10000000, commission=0.002)
stats = bt.run()

bt.plot()
# print(stats)
# display(stats['_trades'])
Row(
id = '77980', …)
Size
- 매수비중 조절
import talib
from backtesting import Backtest, Strategy
from backtesting.lib import crossover, plot_heatmaps, resample_apply

def optim_func(series):

    if series['# Trades'] < 3: #최소 트레이드 회수 제한
        return -1
    #return series['Equity Final [$]'] / series['Exposure Time [%]']
    return series['Sharpe Ratio']


class MyStrategy(Strategy):

    upper_bound = 70
    lower_bound = 30
    rsi_window=14
    position_size=1

    def init(self):
        self.daily_rsi = self.I(talib.RSI, self.data.Close, self.rsi_window)

    def next(self):

        price = self.data.Close[-1] # recent value

        if crossover(self.daily_rsi, self.upper_bound) :
            self.position.close()

        # elif crossover(self.lower_bound, self.daily_rsi):
        #     self.buy(size=0.1) # fractions shares
        elif self.lower_bound > self.daily_rsi[-1]:
            self.buy(size=self.position_size) # fractions shares

bt = Backtest(data, MyStrategy, cash=10000000, commission=0.002)
stats = bt.run()

bt.plot()
print(stats)
display(stats['_trades'])
Start                     2010-01-04 00:00:00
End                       2023-10-06 00:00:00
Duration                   5023 days 00:00:00
Exposure Time [%]                   48.468787
Equity Final [$]                  10169269.44
Equity Peak [$]                   10210942.37
Return [%]                           1.692694
Buy & Hold Return [%]                41.23734
Return (Ann.) [%]                    0.124633
Volatility (Ann.) [%]                0.362115
Sharpe Ratio                          0.34418
Sortino Ratio                        0.518956
Calmar Ratio                         0.087826
Max. Drawdown [%]                   -1.419085
Avg. Drawdown [%]                   -0.056055
Max. Drawdown Duration      647 days 00:00:00
Avg. Drawdown Duration       31 days 00:00:00
# Trades                                  137
Win Rate [%]                        84.671533
Best Trade [%]                      42.892663
Worst Trade [%]                    -21.383705
Avg. Trade [%]                       5.458696
Max. Trade Duration         453 days 00:00:00
Avg. Trade Duration         144 days 00:00:00
Profit Factor                        5.164782
Expectancy [%]                       5.918196
SQN                                  5.235569
_strategy                          MyStrategy
_equity_curve                             ...
_trades                        Size  Entry...
dtype: object
| Size | EntryBar | ExitBar | EntryPrice | ExitPrice | PnL | ReturnPct | EntryTime | ExitTime | Duration | |
|---|---|---|---|---|---|---|---|---|---|---|
| 0 | 1 | 98 | 183 | 20761.44 | 24225.0 | 3463.56 | 0.166827 | 2010-05-26 | 2010-09-28 | 125 days |
| 1 | 1 | 87 | 183 | 21803.52 | 24225.0 | 2421.48 | 0.111059 | 2010-05-10 | 2010-09-28 | 141 days |
| 2 | 1 | 26 | 183 | 20741.40 | 24225.0 | 3483.60 | 0.167954 | 2010-02-09 | 2010-09-28 | 231 days |
| 3 | 1 | 25 | 183 | 21036.99 | 24225.0 | 3188.01 | 0.151543 | 2010-02-08 | 2010-09-28 | 232 days |
| 4 | 1 | 409 | 526 | 22284.48 | 26780.0 | 4495.52 | 0.201733 | 2011-08-23 | 2012-02-10 | 171 days |
| ... | ... | ... | ... | ... | ... | ... | ... | ... | ... | ... |
| 132 | 1 | 2873 | 3174 | 40500.84 | 32435.0 | -8065.84 | -0.199152 | 2021-08-23 | 2022-11-14 | 448 days |
| 133 | 1 | 2872 | 3174 | 40781.40 | 32435.0 | -8346.40 | -0.204662 | 2021-08-20 | 2022-11-14 | 451 days |
| 134 | 1 | 2870 | 3174 | 41257.35 | 32435.0 | -8822.35 | -0.213837 | 2021-08-18 | 2022-11-14 | 453 days |
| 135 | 1 | 3395 | 3395 | 32124.12 | 32060.0 | -64.12 | -0.001996 | 2023-10-06 | 2023-10-06 | 0 days |
| 136 | 1 | 3394 | 3395 | 32299.47 | 32060.0 | -239.47 | -0.007414 | 2023-10-05 | 2023-10-06 | 1 days |
137 rows × 10 columns
barssince
- position을 x일간 유지할 수 있도록 해줌
import talib
from backtesting import Backtest, Strategy
from backtesting.lib import crossover, plot_heatmaps, resample_apply, barssince

def optim_func(series):

    if series['# Trades'] < 3: #최소 트레이드 회수 제한
        return -1
    #return series['Equity Final [$]'] / series['Exposure Time [%]']
    return series['Sharpe Ratio']


class MyStrategy(Strategy):

    upper_bound = 70
    lower_bound = 30
    rsi_window=14
    position_size=0.2

    def init(self):
        self.daily_rsi = self.I(talib.RSI, self.data.Close, self.rsi_window)

    def next(self):

        price = self.data.Close[-1] # recent value

        if (self.daily_rsi[-1] > self.upper_bound and
            barssince(self.daily_rsi < self.upper_bound)==3):
            self.position.close()

        # elif crossover(self.lower_bound, self.daily_rsi):
        #     self.buy(size=0.1) # fractions shares
        elif self.lower_bound > self.daily_rsi[-1]:
            self.buy(size=self.position_size) # fractions shares

bt = Backtest(data, MyStrategy, cash=10000000, commission=0.002)
stats = bt.run()

bt.plot()
print(stats)
display(stats['_trades'])
Start                     2010-01-04 00:00:00
End                       2023-10-06 00:00:00
Duration                   5023 days 00:00:00
Exposure Time [%]                   61.513545
Equity Final [$]                  14904859.33
Equity Peak [$]                   18202293.18
Return [%]                          49.048593
Buy & Hold Return [%]                41.23734
Return (Ann.) [%]                    3.005825
Volatility (Ann.) [%]               12.129955
Sharpe Ratio                         0.247802
Sortino Ratio                        0.372816
Calmar Ratio                         0.108518
Max. Drawdown [%]                  -27.698991
Avg. Drawdown [%]                   -2.020104
Max. Drawdown Duration      760 days 00:00:00
Avg. Drawdown Duration       40 days 00:00:00
# Trades                                  135
Win Rate [%]                        85.925926
Best Trade [%]                      45.531971
Worst Trade [%]                    -22.292634
Avg. Trade [%]                       6.372823
Max. Trade Duration         779 days 00:00:00
Avg. Trade Duration         271 days 00:00:00
Profit Factor                        5.544472
Expectancy [%]                       6.904557
SQN                                  2.777349
_strategy                          MyStrategy
_equity_curve                             ...
_trades                        Size  Entry...
dtype: object
| Size | EntryBar | ExitBar | EntryPrice | ExitPrice | PnL | ReturnPct | EntryTime | ExitTime | Duration | |
|---|---|---|---|---|---|---|---|---|---|---|
| 0 | 49 | 98 | 187 | 20761.44 | 24545.0 | 185394.44 | 0.182240 | 2010-05-26 | 2010-10-04 | 131 days |
| 1 | 58 | 87 | 187 | 21803.52 | 24545.0 | 159005.84 | 0.125736 | 2010-05-10 | 2010-10-04 | 147 days |
| 2 | 77 | 26 | 187 | 20741.40 | 24545.0 | 292877.20 | 0.183382 | 2010-02-09 | 2010-10-04 | 237 days |
| 3 | 95 | 25 | 187 | 21036.99 | 24545.0 | 333260.95 | 0.166754 | 2010-02-08 | 2010-10-04 | 238 days |
| 4 | 2 | 604 | 739 | 23997.90 | 26540.0 | 5084.20 | 0.105930 | 2012-06-05 | 2012-12-17 | 195 days |
| ... | ... | ... | ... | ... | ... | ... | ... | ... | ... | ... |
| 130 | 37 | 2901 | 3395 | 39138.12 | 32060.0 | -261890.44 | -0.180850 | 2021-10-06 | 2023-10-06 | 730 days |
| 131 | 47 | 2900 | 3395 | 39163.17 | 32060.0 | -333848.99 | -0.181374 | 2021-10-05 | 2023-10-06 | 731 days |
| 132 | 56 | 2873 | 3395 | 40500.84 | 32060.0 | -472687.04 | -0.208411 | 2021-08-23 | 2023-10-06 | 774 days |
| 133 | 70 | 2872 | 3395 | 40781.40 | 32060.0 | -610498.00 | -0.213857 | 2021-08-20 | 2023-10-06 | 777 days |
| 134 | 87 | 2870 | 3395 | 41257.35 | 32060.0 | -800169.45 | -0.222926 | 2021-08-18 | 2023-10-06 | 779 days |
135 rows × 10 columns
strategies
strategy : SAR, MACD
import talib
from backtesting import Backtest, Strategy
from backtesting.lib import crossover, plot_heatmaps, resample_apply, barssince

class MyStrategy(Strategy):
    position_size=0.2

    def init(self):
        #Parabolic SAR 지표 계산
        self.sar = self.I(talib.SAR, self.data.High, self.data.Low, acceleration=0.02, maximum=0.2)
        # MACD 지표 계산
        self.macd_line, self.signal_line, self.macd_hist = self.I(talib.MACD,
             self.data.Close, fastperiod=12, slowperiod=26, signalperiod=9)

    def next(self):

        price = self.data.Close[-1] # recent value

        # 매수
        if (self.data.Close > self.sar and self.macd_hist > 0):
            self.buy(size=self.position_size)#, sl=0.95*price, tp=1.05*price)

        # 매도
        elif (self.sar > self.data.Close and self.macd_hist < 0):
            self.position.close()


bt = Backtest(data, MyStrategy, cash=1000000, commission=0.002)
stats = bt.run()

bt.plot()
print(stats)
display(stats['_trades'])
Start                     2010-01-04 00:00:00
End                       2023-10-06 00:00:00
Duration                   5023 days 00:00:00
Exposure Time [%]                   55.742049
Equity Final [$]                    1068093.2
Equity Peak [$]                    1201059.73
Return [%]                            6.80932
Buy & Hold Return [%]                41.23734
Return (Ann.) [%]                    0.490022
Volatility (Ann.) [%]                8.184861
Sharpe Ratio                         0.059869
Sortino Ratio                        0.084004
Calmar Ratio                         0.019785
Max. Drawdown [%]                   -24.76673
Avg. Drawdown [%]                   -2.160225
Max. Drawdown Duration     4547 days 00:00:00
Avg. Drawdown Duration      236 days 00:00:00
# Trades                                  977
Win Rate [%]                        38.689867
Best Trade [%]                       13.92485
Worst Trade [%]                     -9.015166
Avg. Trade [%]                       0.024117
Max. Trade Duration          70 days 00:00:00
Avg. Trade Duration          22 days 00:00:00
Profit Factor                        1.064758
Expectancy [%]                       0.083349
SQN                                  0.555778
_strategy                          MyStrategy
_equity_curve                            E...
_trades                        Size  Entry...
dtype: object
| Size | EntryBar | ExitBar | EntryPrice | ExitPrice | PnL | ReturnPct | EntryTime | ExitTime | Duration | |
|---|---|---|---|---|---|---|---|---|---|---|
| 0 | 1 | 52 | 70 | 22439.79 | 22935.0 | 495.21 | 0.022068 | 2010-03-19 | 2010-04-14 | 26 days |
| 1 | 1 | 51 | 70 | 22389.69 | 22935.0 | 545.31 | 0.024355 | 2010-03-18 | 2010-04-14 | 27 days |
| 2 | 1 | 50 | 70 | 22209.33 | 22935.0 | 725.67 | 0.032674 | 2010-03-17 | 2010-04-14 | 28 days |
| 3 | 1 | 49 | 70 | 22038.99 | 22935.0 | 896.01 | 0.040656 | 2010-03-16 | 2010-04-14 | 29 days |
| 4 | 1 | 48 | 70 | 22214.34 | 22935.0 | 720.66 | 0.032441 | 2010-03-15 | 2010-04-14 | 30 days |
| ... | ... | ... | ... | ... | ... | ... | ... | ... | ... | ... |
| 972 | 2 | 3377 | 3389 | 34093.05 | 33005.0 | -2176.10 | -0.031914 | 2023-09-06 | 2023-09-22 | 16 days |
| 973 | 3 | 3376 | 3389 | 34108.08 | 33005.0 | -3309.24 | -0.032341 | 2023-09-05 | 2023-09-22 | 17 days |
| 974 | 4 | 3375 | 3389 | 34078.02 | 33005.0 | -4292.08 | -0.031487 | 2023-09-04 | 2023-09-22 | 18 days |
| 975 | 5 | 3374 | 3389 | 33551.97 | 33005.0 | -2734.85 | -0.016302 | 2023-09-01 | 2023-09-22 | 21 days |
| 976 | 6 | 3373 | 3389 | 33697.26 | 33005.0 | -4153.56 | -0.020544 | 2023-08-31 | 2023-09-22 | 22 days |
977 rows × 10 columns
stats['_trades']
| Size | EntryBar | ExitBar | EntryPrice | ExitPrice | PnL | ReturnPct | EntryTime | ExitTime | Duration | |
|---|---|---|---|---|---|---|---|---|---|---|
| 0 | 387 | 156 | 460 | 25821.54 | 15530.0 | -3982825.98 | -0.398564 | 2021-08-18 | 2022-11-14 | 453 days |
| 1 | 399 | 680 | 681 | 15075.09 | 14920.0 | -61880.91 | -0.010288 | 2023-10-05 | 2023-10-06 | 1 days |
MACD strategy
import talib
from backtesting import Backtest, Strategy
from backtesting.lib import crossover, plot_heatmaps

def optim_func(series):

    if series['# Trades'] < 3: #최소 트레이드 회수 제한
        return -1
    #return series['Equity Final [$]'] / series['Exposure Time [%]']
    return series['Sharpe Ratio']


class MyStrategy(Strategy):

    fast_period = 12
    slow_period = 26
    signal_period = 9

    def init(self):
        self.macd_line, self.signal_line, self.macd_hist = self.I(talib.MACD,
             self.data.Close, fastperiod=self.fast_period, slowperiod=self.slow_period, signalperiod=self.signal_period)

    def next(self):
        if crossover(self.signal_line, self.macd_line):
            self.position.close()
        elif crossover(self.macd_line, self.signal_line):
            self.buy()

bt = Backtest(data, MyStrategy, cash=10000000, commission=0.002)
stats, heatmap = bt.optimize(
    fast_period=range(9, 25, 3),
    slow_period=range(20, 50, 3),
    signal_period=range(8, 25, 3),
    maximize = optim_func,#'Sharpe Ratio',
    constraint = lambda param : param.fast_period < param.slow_period,
    return_heatmap=True
    )

#print(heatmap)

hm = heatmap.groupby(['fast_period', 'slow_period']).mean().unstack()
#print(hm)
# sns.heatmap(hm, annot=True, cmap='viridis')
# plt.show()
plot_heatmaps(heatmap, agg='mean')

fast_period = stats['_strategy'].fast_period
slow_period = stats['_strategy'].slow_period
signal_period = stats['_strategy'].signal_period
print("best :", fast_period,"-", slow_period,"-", signal_period)
print(stats)

bt.plot()
display(stats['_trades'])
best : 18 - 20 - 11
Start                     2010-01-04 00:00:00
End                       2023-10-06 00:00:00
Duration                   5023 days 00:00:00
Exposure Time [%]                   53.739694
Equity Final [$]                  15981353.49
Equity Peak [$]                   17669529.69
Return [%]                          59.813535
Buy & Hold Return [%]                41.23734
Return (Ann.) [%]                    3.540232
Volatility (Ann.) [%]               11.569808
Sharpe Ratio                         0.305989
Sortino Ratio                        0.452202
Calmar Ratio                         0.141107
Max. Drawdown [%]                  -25.088971
Avg. Drawdown [%]                    -3.49389
Max. Drawdown Duration     2195 days 00:00:00
Avg. Drawdown Duration      125 days 00:00:00
# Trades                                  108
Win Rate [%]                        38.888889
Best Trade [%]                      15.241274
Worst Trade [%]                     -7.939919
Avg. Trade [%]                        0.43567
Max. Trade Duration          77 days 00:00:00
Avg. Trade Duration          24 days 00:00:00
Profit Factor                        1.439068
Expectancy [%]                       0.515966
SQN                                   1.09744
_strategy                 MyStrategy(fast_...
_equity_curve                             ...
_trades                        Size  Entry...
dtype: object
| Size | EntryBar | ExitBar | EntryPrice | ExitPrice | PnL | ReturnPct | EntryTime | ExitTime | Duration | |
|---|---|---|---|---|---|---|---|---|---|---|
| 0 | 457 | 32 | 74 | 21858.63 | 22860.0 | 457626.09 | 0.045811 | 2010-02-18 | 2010-04-20 | 61 days |
| 1 | 476 | 104 | 124 | 21958.83 | 21960.0 | 556.92 | 0.000053 | 2010-06-04 | 2010-07-02 | 28 days |
| 2 | 458 | 131 | 153 | 22790.49 | 22700.0 | -41444.42 | -0.003971 | 2010-07-13 | 2010-08-12 | 30 days |
| 3 | 444 | 171 | 195 | 23446.80 | 24505.0 | 469840.80 | 0.045132 | 2010-09-07 | 2010-10-14 | 37 days |
| 4 | 428 | 211 | 218 | 25400.70 | 25000.0 | -171499.60 | -0.015775 | 2010-11-05 | 2010-11-16 | 11 days |
| ... | ... | ... | ... | ... | ... | ... | ... | ... | ... | ... |
| 103 | 481 | 3214 | 3237 | 31407.69 | 32825.0 | 681726.11 | 0.045126 | 2023-01-10 | 2023-02-14 | 35 days |
| 104 | 493 | 3265 | 3287 | 31978.83 | 32905.0 | 456601.81 | 0.028962 | 2023-03-27 | 2023-04-26 | 30 days |
| 105 | 479 | 3304 | 3323 | 33882.63 | 34230.0 | 166390.23 | 0.010252 | 2023-05-23 | 2023-06-21 | 29 days |
| 106 | 472 | 3341 | 3355 | 34739.34 | 34275.0 | -219168.48 | -0.013366 | 2023-07-17 | 2023-08-04 | 18 days |
| 107 | 482 | 3374 | 3390 | 33551.97 | 33105.0 | -215439.54 | -0.013322 | 2023-09-01 | 2023-09-25 | 24 days |
108 rows × 10 columns
strategy : SAR
import talib
from backtesting import Backtest, Strategy
from backtesting.lib import crossover, plot_heatmaps

def optim_func(series):

    if series['# Trades'] < 3: #최소 트레이드 회수 제한
        return -1
    #return series['Equity Final [$]'] / series['Exposure Time [%]']
#    return series['Sharpe Ratio']
    return series['Equity Final [$]']


class MyStrategy(Strategy):

    acceleration = 0.02
    maximum=0.2
    def init(self):
        self.sar = self.I(talib.SAR, self.data.High, self.data.Low, acceleration=self.acceleration, maximum=self.maximum)

    def next(self):
        if crossover(self.data.Close, self.sar):
            self.buy()
        elif crossover(self.sar, self.data.Close):
            self.position.close()

bt = Backtest(data, MyStrategy, cash=10000000, commission=0.002)
stats, heatmap = bt.optimize(
    acceleration=0.02, #np.arange(0.01, 0.05, 0.01).tolist(),
    maximum=0.2, #np.arange(0.1, 0.25, 0.01).tolist(),
    maximize = optim_func,#'Sharpe Ratio',
    #constraint = lambda param : param.fast_period < param.slow_period,
    return_heatmap=True
    )

#print(heatmap)

hm = heatmap.groupby(['acceleration', 'maximum']).mean().unstack()
#print(hm)
# sns.heatmap(hm, annot=True, cmap='viridis')
# plt.show()
plot_heatmaps(heatmap, agg='mean')

acceleration = stats['_strategy'].acceleration
maximum = stats['_strategy'].maximum

print("best :", acceleration,"-", maximum)
print(stats)

bt.plot()
display(stats['_trades'])
0%| | 0/1 [00:00<?, ?it/s]
best : 0.02 - 0.2
Start                     2010-01-04 00:00:00
End                       2023-10-06 00:00:00
Duration                   5023 days 00:00:00
Exposure Time [%]                   58.186101
Equity Final [$]                   11100358.3
Equity Peak [$]                   12748303.25
Return [%]                          11.003583
Buy & Hold Return [%]                41.23734
Return (Ann.) [%]                    0.777651
Volatility (Ann.) [%]               10.952246
Sharpe Ratio                         0.071004
Sortino Ratio                        0.102097
Calmar Ratio                         0.023512
Max. Drawdown [%]                  -33.074381
Avg. Drawdown [%]                   -5.483589
Max. Drawdown Duration     3638 days 00:00:00
Avg. Drawdown Duration      332 days 00:00:00
# Trades                                  150
Win Rate [%]                        35.333333
Best Trade [%]                      15.752356
Worst Trade [%]                     -6.348752
Avg. Trade [%]                       0.069374
Max. Trade Duration          55 days 00:00:00
Avg. Trade Duration          18 days 00:00:00
Profit Factor                         1.10156
Expectancy [%]                       0.130881
SQN                                  0.259607
_strategy                 MyStrategy(accel...
_equity_curve                             ...
_trades                        Size  Entry...
dtype: object
| Size | EntryBar | ExitBar | EntryPrice | ExitPrice | PnL | ReturnPct | EntryTime | ExitTime | Duration | |
|---|---|---|---|---|---|---|---|---|---|---|
| 0 | 435 | 11 | 15 | 22935.78 | 22175.0 | -330939.30 | -0.033170 | 2010-01-19 | 2010-01-25 | 6 days |
| 1 | 451 | 29 | 38 | 21402.72 | 21250.0 | -68876.72 | -0.007136 | 2010-02-12 | 2010-02-26 | 14 days |
| 2 | 434 | 43 | 68 | 22079.07 | 23170.0 | 473463.62 | 0.049410 | 2010-03-08 | 2010-04-12 | 35 days |
| 3 | 431 | 71 | 74 | 23346.60 | 22860.0 | -209724.60 | -0.020842 | 2010-04-15 | 2010-04-20 | 5 days |
| 4 | 425 | 76 | 82 | 23176.26 | 22910.0 | -113160.50 | -0.011488 | 2010-04-22 | 2010-04-30 | 8 days |
| ... | ... | ... | ... | ... | ... | ... | ... | ... | ... | ... |
| 145 | 336 | 3264 | 3285 | 31973.82 | 33470.0 | 502716.48 | 0.046794 | 2023-03-24 | 2023-04-24 | 31 days |
| 146 | 337 | 3302 | 3320 | 33326.52 | 34555.0 | 413997.76 | 0.036862 | 2023-05-19 | 2023-06-16 | 28 days |
| 147 | 337 | 3332 | 3336 | 34543.95 | 33340.0 | -405731.15 | -0.034853 | 2023-07-04 | 2023-07-10 | 6 days |
| 148 | 325 | 3340 | 3355 | 34609.08 | 34275.0 | -108576.00 | -0.009653 | 2023-07-14 | 2023-08-04 | 21 days |
| 149 | 329 | 3372 | 3388 | 33857.58 | 33715.0 | -46908.82 | -0.004211 | 2023-08-30 | 2023-09-21 | 22 days |
150 rows × 10 columns
SMA, RSI
import talib
from backtesting import Backtest, Strategy
from backtesting.lib import crossover, plot_heatmaps, resample_apply, barssince

class MyStrategy(Strategy):
    rsi_window=14
    short_period=60
    long_period=120
    upper_bound=65
    lower_bound=45

    def init(self):
        self.rsi = self.I(talib.RSI, self.data.Close, self.rsi_window)
        self.ma_short = self.I(talib.SMA, self.data.Close, self.short_period)
        self.ma_long = self.I(talib.SMA, self.data.Close, self.long_period)

    def next(self):
        # 매수
        if (self.rsi < self.lower_bound and self.ma_short > self.ma_long):
            self.buy()

        # 매도
        elif (self.rsi > self.upper_bound and self.ma_short < self.ma_long):
            self.position.close()


bt = Backtest(data, MyStrategy, cash=1000000, commission=0.002)
stats = bt.run()

bt.plot()
print(stats)
display(stats['_trades'])
Start                     2010-01-04 00:00:00
End                       2023-10-06 00:00:00
Duration                   5023 days 00:00:00
Exposure Time [%]                   77.532391
Equity Final [$]                   1325733.23
Equity Peak [$]                    1866205.41
Return [%]                          32.573323
Buy & Hold Return [%]                41.23734
Return (Ann.) [%]                    2.114367
Volatility (Ann.) [%]               15.595352
Sharpe Ratio                         0.135577
Sortino Ratio                         0.19576
Calmar Ratio                         0.058773
Max. Drawdown [%]                   -35.97514
Avg. Drawdown [%]                   -3.603827
Max. Drawdown Duration     2222 days 00:00:00
Avg. Drawdown Duration      108 days 00:00:00
# Trades                                   13
Win Rate [%]                        61.538462
Best Trade [%]                      19.740756
Worst Trade [%]                     -6.503583
Avg. Trade [%]                       2.474779
Max. Trade Duration         777 days 00:00:00
Avg. Trade Duration         310 days 00:00:00
Profit Factor                         4.40458
Expectancy [%]                       2.711425
SQN                                  1.122675
_strategy                          MyStrategy
_equity_curve                             ...
_trades                       Size  EntryB...
dtype: object
| Size | EntryBar | ExitBar | EntryPrice | ExitPrice | PnL | ReturnPct | EntryTime | ExitTime | Duration | |
|---|---|---|---|---|---|---|---|---|---|---|
| 0 | 45 | 124 | 651 | 22003.92 | 25890.0 | 174873.60 | 0.176609 | 2010-07-02 | 2012-08-10 | 770 days |
| 1 | 46 | 692 | 918 | 25450.80 | 25420.0 | -1416.80 | -0.001210 | 2012-10-11 | 2013-09-06 | 330 days |
| 2 | 44 | 958 | 1062 | 26117.13 | 26400.0 | 12446.28 | 0.010831 | 2013-11-08 | 2014-04-10 | 153 days |
| 3 | 1 | 1182 | 1279 | 24829.56 | 25625.0 | 795.44 | 0.032036 | 2014-10-10 | 2015-03-04 | 145 days |
| 4 | 45 | 1104 | 1279 | 25801.50 | 25625.0 | -7942.50 | -0.006841 | 2014-06-16 | 2015-03-04 | 261 days |
| 5 | 44 | 1323 | 1430 | 26332.56 | 24620.0 | -75352.64 | -0.065036 | 2015-05-07 | 2015-10-12 | 158 days |
| 6 | 45 | 1470 | 1529 | 24423.75 | 24460.0 | 1631.25 | 0.001484 | 2015-12-07 | 2016-03-08 | 92 days |
| 7 | 44 | 1566 | 1626 | 24579.06 | 25210.0 | 27761.36 | 0.025670 | 2016-04-29 | 2016-07-27 | 89 days |
| 8 | 44 | 1659 | 2157 | 25350.60 | 30355.0 | 220193.60 | 0.197408 | 2016-09-13 | 2018-09-28 | 745 days |
| 9 | 48 | 2268 | 2340 | 28116.12 | 27890.0 | -10853.76 | -0.008042 | 2019-03-15 | 2019-06-28 | 105 days |
| 10 | 48 | 2446 | 2568 | 27930.75 | 27305.0 | -30036.00 | -0.022404 | 2019-12-02 | 2020-06-02 | 183 days |
| 11 | 42 | 2648 | 3171 | 31067.01 | 31375.0 | 12935.58 | 0.009914 | 2020-09-23 | 2022-11-09 | 777 days |
| 12 | 41 | 3247 | 3395 | 31993.86 | 32060.0 | 2711.74 | 0.002067 | 2023-02-28 | 2023-10-06 | 220 days |
import talib
from backtesting import Backtest, Strategy
from backtesting.lib import crossover, plot_heatmaps, resample_apply, barssince

class MyStrategy(Strategy):
    short_period=60
    long_period=120

    rsi_window = 14
    upper_bound = 70
    lower_bound = 30

    position_size = 1

    def init(self):
        self.ma_short = self.I(talib.SMA, self.data.Close, self.short_period)
        self.ma_long = self.I(talib.SMA, self.data.Close, self.long_period)
        self.rsi = self.I(talib.RSI, self.data.Close, self.rsi_window)

    def next(self):

        price = self.data.Close[-1]
        # 매수
        if (self.ma_short > self.ma_long and self.rsi < self.lower_bound):
            # if self.position.is_short or not self.position:
            #     self.position.close()
            self.buy(sl=0.8*price)

        # 매도
        elif (self.ma_short < self.ma_long and self.rsi > self.upper_bound):
            # if self.position.is_long:
            self.position.close()
              #   self.sell()


bt = Backtest(data, MyStrategy, cash=10000000, commission=0.002)
stats, heatmap = bt.optimize(
    short_period=range(5, 45, 10), #np.arange(0.01, 0.05, 0.01).tolist(),
    long_period=range(20, 80, 10), #np.arange(0.1, 0.25, 0.01).tolist(),
    rsi_window=range(10, 22, 2),
    maximize = 'Equity Final [$]', #'Sharpe Ratio',
    constraint = lambda param : param.short_period < param.long_period,
    return_heatmap=True,
    max_tries=100
    )

#print(heatmap)

hm = heatmap.groupby(['short_period', 'long_period']).mean().unstack()
#print(hm)
# sns.heatmap(hm, annot=True, cmap='viridis')
# plt.show()
plot_heatmaps(heatmap, agg='mean')

short_period = stats['_strategy'].short_period
long_period = stats['_strategy'].long_period
rsi_window = stats['_strategy'].rsi_window
print("best :", short_period,"-", long_period, "-", rsi_window)
print(stats)

bt.plot()
display(stats['_trades'])
0%| | 0/9 [00:00<?, ?it/s]
best : 5 - 70 - 14
Start                     2010-01-04 00:00:00
End                       2023-10-06 00:00:00
Duration                   5023 days 00:00:00
Exposure Time [%]                   97.438163
Equity Final [$]                  14697467.84
Equity Peak [$]                   20285067.84
Return [%]                          46.974678
Buy & Hold Return [%]                41.23734
Return (Ann.) [%]                    2.898779
Volatility (Ann.) [%]               17.463108
Sharpe Ratio                         0.165994
Sortino Ratio                        0.242547
Calmar Ratio                         0.071368
Max. Drawdown [%]                   -40.61749
Avg. Drawdown [%]                   -3.581652
Max. Drawdown Duration     2205 days 00:00:00
Avg. Drawdown Duration       96 days 00:00:00
# Trades                                    1
Win Rate [%]                            100.0
Best Trade [%]                      47.040478
Worst Trade [%]                     47.040478
Avg. Trade [%]                      47.040478
Max. Trade Duration        4897 days 00:00:00
Avg. Trade Duration        4897 days 00:00:00
Profit Factor                             NaN
Expectancy [%]                      47.040478
SQN                                       NaN
_strategy                 MyStrategy(short...
_equity_curve                             ...
_trades                      Size  EntryBa...
dtype: object
| Size | EntryBar | ExitBar | EntryPrice | ExitPrice | PnL | ReturnPct | EntryTime | ExitTime | Duration | |
|---|---|---|---|---|---|---|---|---|---|---|
| 0 | 458 | 87 | 3395 | 21803.52 | 32060.0 | 4697467.84 | 0.470405 | 2010-05-10 | 2023-10-06 | 4897 days |
댓글남기기